
Page 53 - TakePropips Trading Management Solutions
P. 53
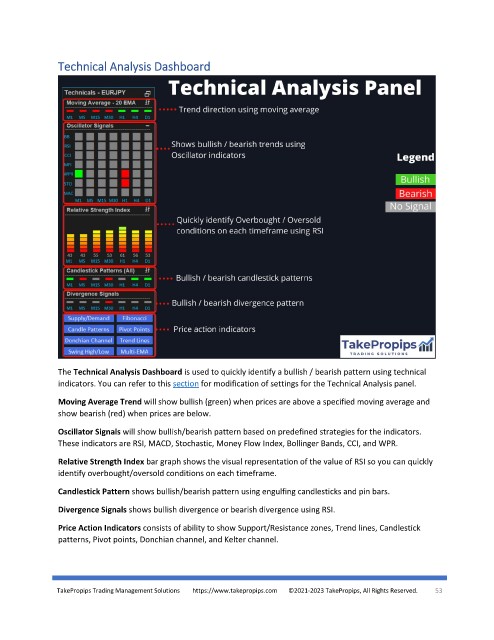
Technical Analysis Dashboard


               The Technical Analysis Dashboard is used to quickly identify a bullish / bearish pattern using technical
               indicators. You can refer to this section for modification of settings for the Technical Analysis panel.

               Moving Average Trend will show bullish (green) when prices are above a specified moving average and
               show bearish (red) when prices are below.

               Oscillator Signals will show bullish/bearish pattern based on predefined strategies for the indicators.
               These indicators are RSI, MACD, Stochastic, Money Flow Index, Bollinger Bands, CCI, and WPR.

               Relative Strength Index bar graph shows the visual representation of the value of RSI so you can quickly
               identify overbought/oversold conditions on each timeframe.
               Candlestick Pattern shows bullish/bearish pattern using engulfing candlesticks and pin bars.

               Divergence Signals shows bullish divergence or bearish divergence using RSI.

               Price Action Indicators consists of ability to show Support/Resistance zones, Trend lines, Candlestick
               patterns, Pivot points, Donchian channel, and Kelter channel.


               TakePropips Trading Management Solutions        https://www.takepropips.com       ©2021-2023 TakePropips, All Rights Reserved.   53