
Page 54 - TakePropips Trading Management Solutions
P. 54
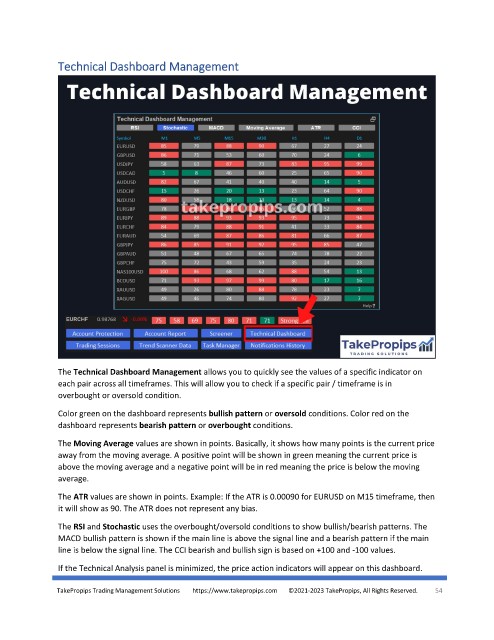
Technical Dashboard Management


               The Technical Dashboard Management allows you to quickly see the values of a specific indicator on
               each pair across all timeframes. This will allow you to check if a specific pair / timeframe is in
               overbought or oversold condition.

               Color green on the dashboard represents bullish pattern or oversold conditions. Color red on the
               dashboard represents bearish pattern or overbought conditions.

               The Moving Average values are shown in points. Basically, it shows how many points is the current price
               away from the moving average. A positive point will be shown in green meaning the current price is
               above the moving average and a negative point will be in red meaning the price is below the moving
               average.

               The ATR values are shown in points. Example: If the ATR is 0.00090 for EURUSD on M15 timeframe, then
               it will show as 90. The ATR does not represent any bias.

               The RSI and Stochastic uses the overbought/oversold conditions to show bullish/bearish patterns. The
               MACD bullish pattern is shown if the main line is above the signal line and a bearish pattern if the main
               line is below the signal line. The CCI bearish and bullish sign is based on +100 and -100 values.

               If the Technical Analysis panel is minimized, the price action indicators will appear on this dashboard.

               TakePropips Trading Management Solutions        https://www.takepropips.com       ©2021-2023 TakePropips, All Rights Reserved.   54