
Page 69 - TakePropips Trading Management Solutions
P. 69
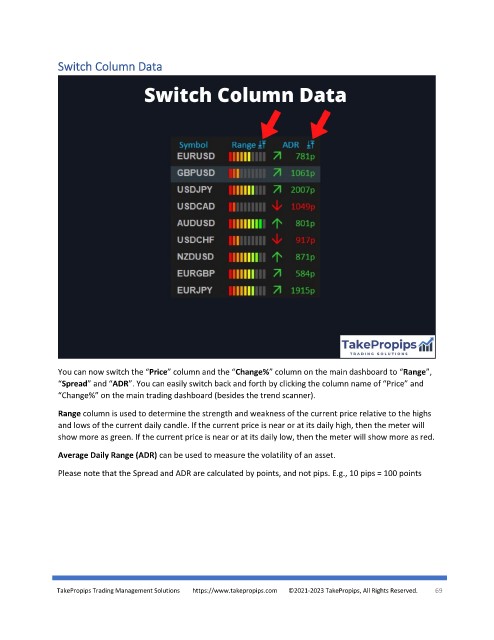
Switch Column Data


               You can now switch the “Price” column and the “Change%” column on the main dashboard to “Range”,
               “Spread” and “ADR”. You can easily switch back and forth by clicking the column name of “Price” and
               “Change%” on the main trading dashboard (besides the trend scanner).

               Range column is used to determine the strength and weakness of the current price relative to the highs
               and lows of the current daily candle. If the current price is near or at its daily high, then the meter will
               show more as green. If the current price is near or at its daily low, then the meter will show more as red.

               Average Daily Range (ADR) can be used to measure the volatility of an asset.

               Please note that the Spread and ADR are calculated by points, and not pips. E.g., 10 pips = 100 points


               TakePropips Trading Management Solutions        https://www.takepropips.com       ©2021-2023 TakePropips, All Rights Reserved.   69