
Page 28 - TakePropips Trading Management Solutions
P. 28
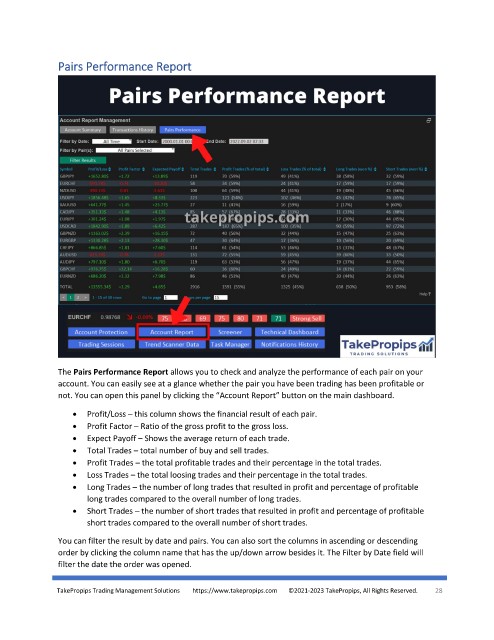
Pairs Performance Report


               The Pairs Performance Report allows you to check and analyze the performance of each pair on your
               account. You can easily see at a glance whether the pair you have been trading has been profitable or
               not. You can open this panel by clicking the “Account Report” button on the main dashboard.

                   •  Profit/Loss – this column shows the financial result of each pair.
                   •  Profit Factor – Ratio of the gross profit to the gross loss.
                   •  Expect Payoff – Shows the average return of each trade.
                   •  Total Trades – total number of buy and sell trades.
                   •  Profit Trades – the total profitable trades and their percentage in the total trades.
                   •  Loss Trades – the total loosing trades and their percentage in the total trades.
                   •  Long Trades – the number of long trades that resulted in profit and percentage of profitable
                       long trades compared to the overall number of long trades.
                   •  Short Trades – the number of short trades that resulted in profit and percentage of profitable
                       short trades compared to the overall number of short trades.

               You can filter the result by date and pairs. You can also sort the columns in ascending or descending
               order by clicking the column name that has the up/down arrow besides it. The Filter by Date field will
               filter the date the order was opened.

               TakePropips Trading Management Solutions        https://www.takepropips.com       ©2021-2023 TakePropips, All Rights Reserved.   28