
Page 114 - TakePropips Trading Management Solutions
P. 114
Williams Percent Range Buy Level - the buy level for WPR indicator.
Williams Percent Range Sell Level - the sell level for WPR indicator.
Money Flow Index Buy Level - the buy level for MFI indicator.
Money Flow Index Sell Level - the sell level for MFI indicator.
Commodity Channel Index Buy Level - the buy level for CCI indicator.
Commodity Channel Index Sell Level - the sell level for CCI indicator.
Relative Strength Index Buy Level – the buy level for RSI indicator.
Relative Strength Index Sell Level – the sell level for RSI indicator.
Bollinger Bands Period – the period for Bollinger Bands indicator.
Bollinger Bands Deviation – the standard deviation for the Bollinger Bands indicator.
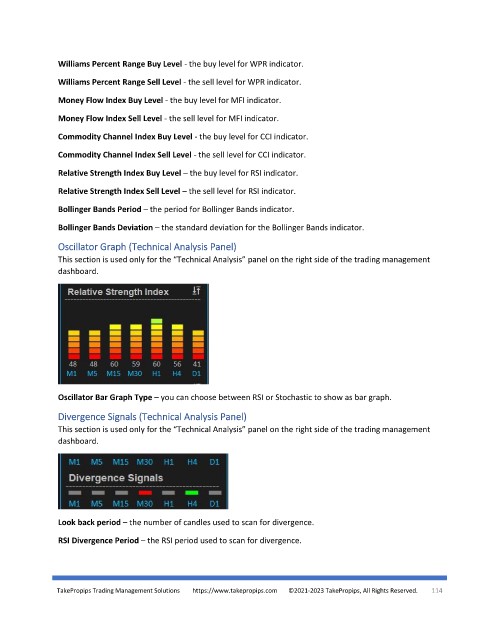
Oscillator Graph (Technical Analysis Panel)
This section is used only for the “Technical Analysis” panel on the right side of the trading management
dashboard.
Oscillator Bar Graph Type – you can choose between RSI or Stochastic to show as bar graph.
Divergence Signals (Technical Analysis Panel)
This section is used only for the “Technical Analysis” panel on the right side of the trading management
dashboard.
Look back period – the number of candles used to scan for divergence.
RSI Divergence Period – the RSI period used to scan for divergence.
TakePropips Trading Management Solutions https://www.takepropips.com ©2021-2023 TakePropips, All Rights Reserved. 114