
Page 10 - TakePropips Trading Management Solutions
P. 10
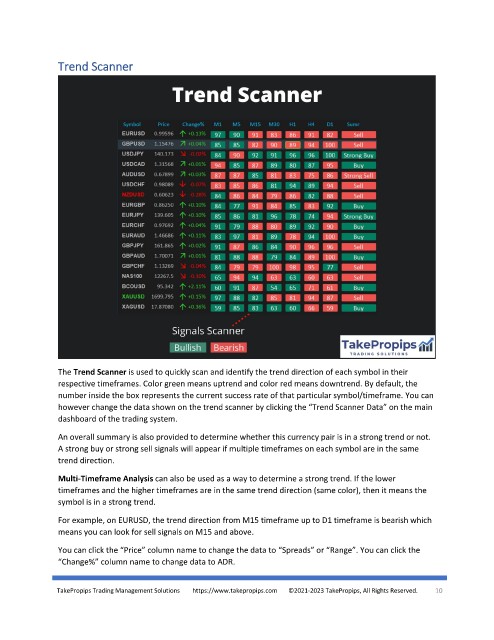
Trend Scanner


               The Trend Scanner is used to quickly scan and identify the trend direction of each symbol in their
               respective timeframes. Color green means uptrend and color red means downtrend. By default, the
               number inside the box represents the current success rate of that particular symbol/timeframe. You can
               however change the data shown on the trend scanner by clicking the “Trend Scanner Data” on the main
               dashboard of the trading system.

               An overall summary is also provided to determine whether this currency pair is in a strong trend or not.
               A strong buy or strong sell signals will appear if multiple timeframes on each symbol are in the same
               trend direction.
               Multi-Timeframe Analysis can also be used as a way to determine a strong trend. If the lower
               timeframes and the higher timeframes are in the same trend direction (same color), then it means the
               symbol is in a strong trend.

               For example, on EURUSD, the trend direction from M15 timeframe up to D1 timeframe is bearish which
               means you can look for sell signals on M15 and above.
               You can click the “Price” column name to change the data to “Spreads” or “Range”. You can click the
               “Change%” column name to change data to ADR.


               TakePropips Trading Management Solutions        https://www.takepropips.com       ©2021-2023 TakePropips, All Rights Reserved.   10